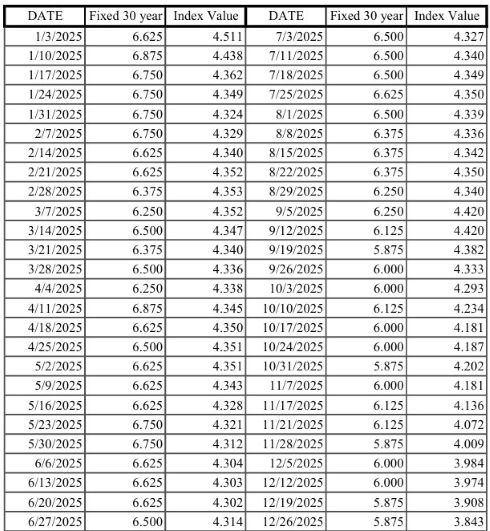
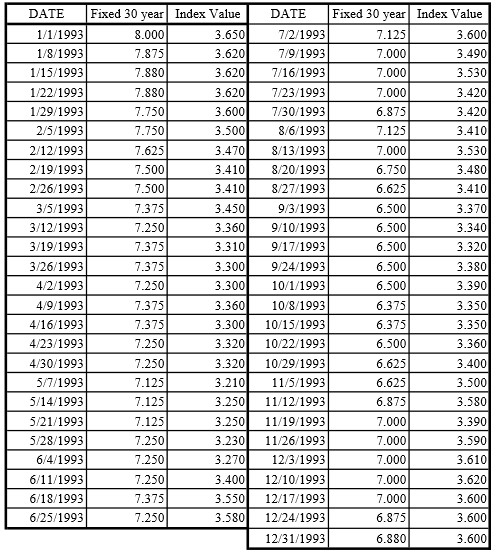
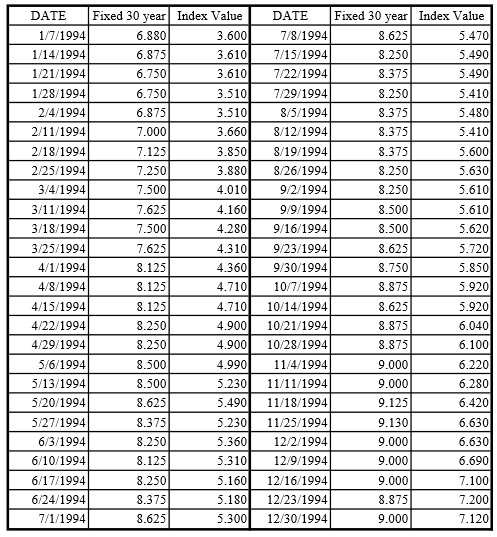
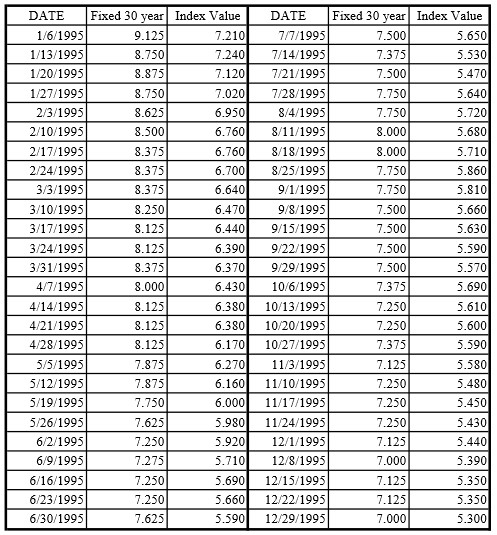
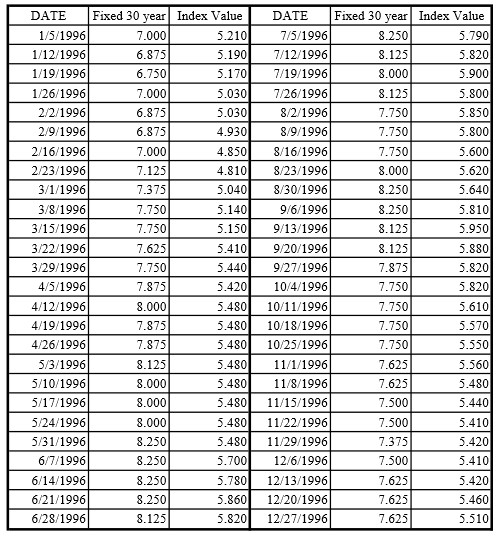
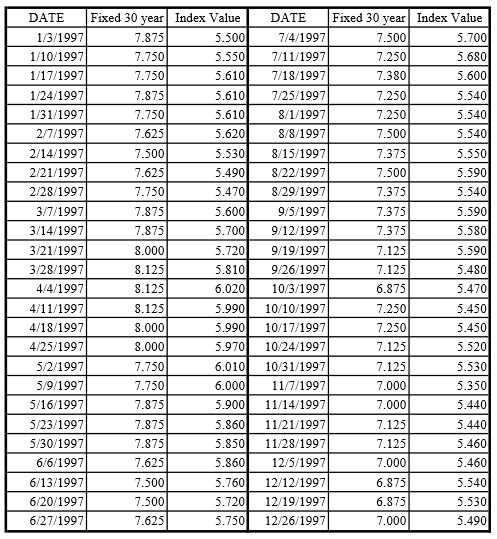
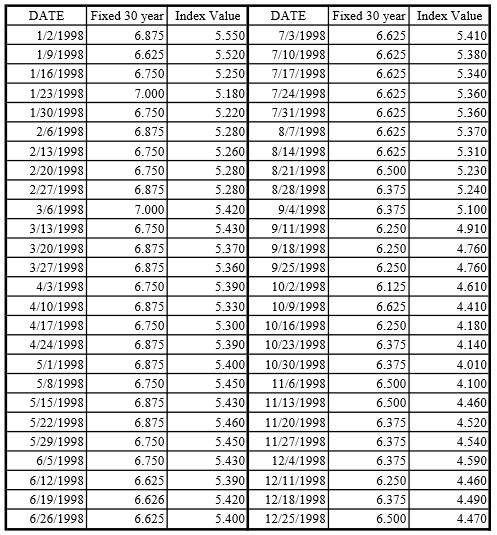
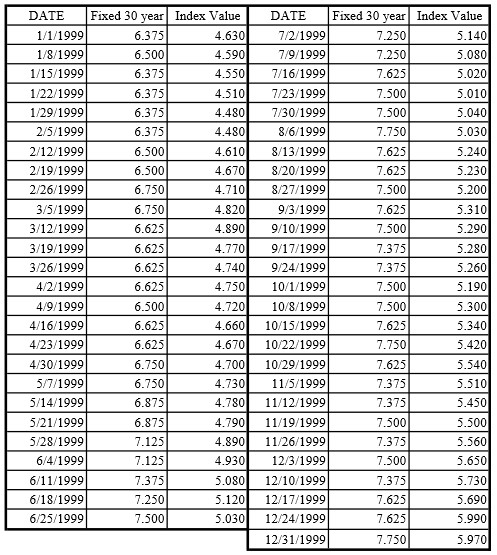
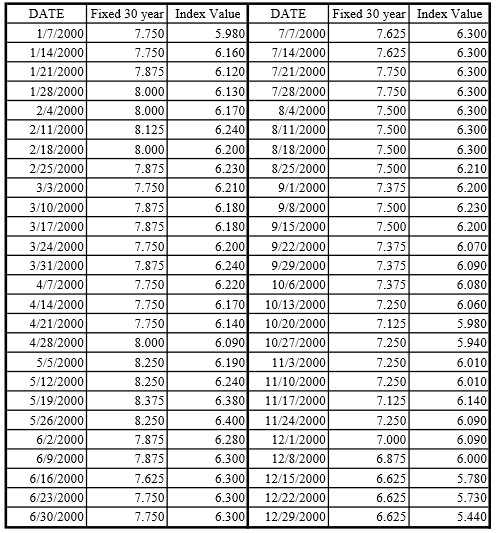
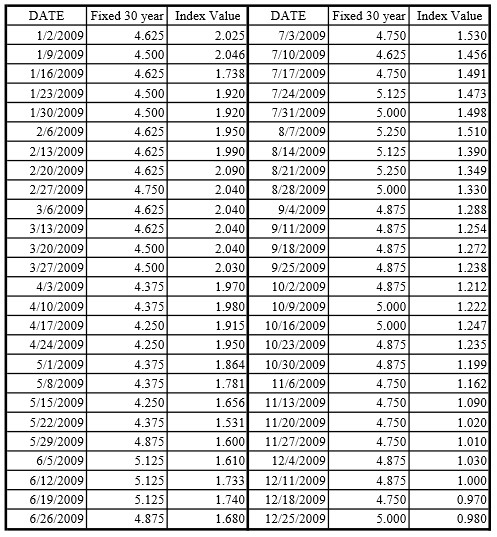
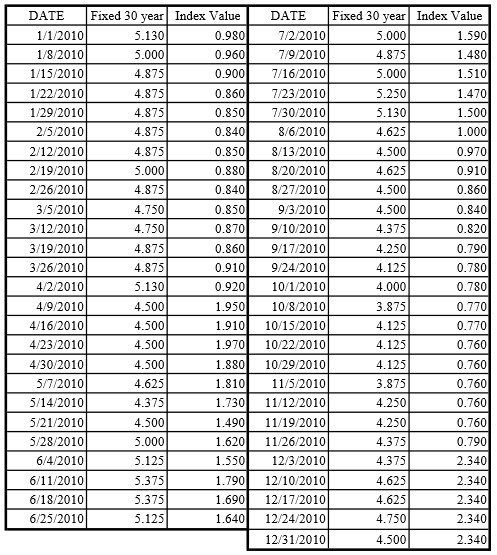
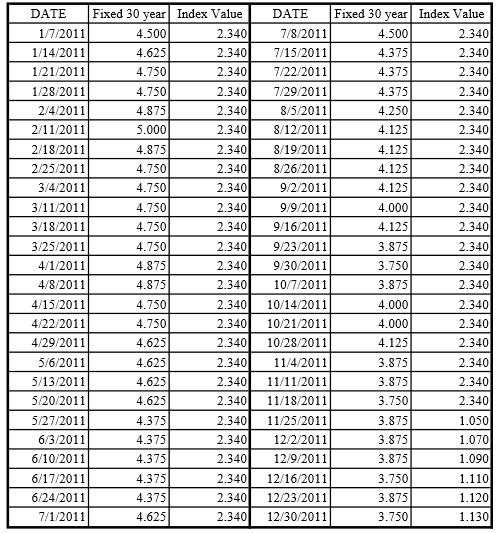
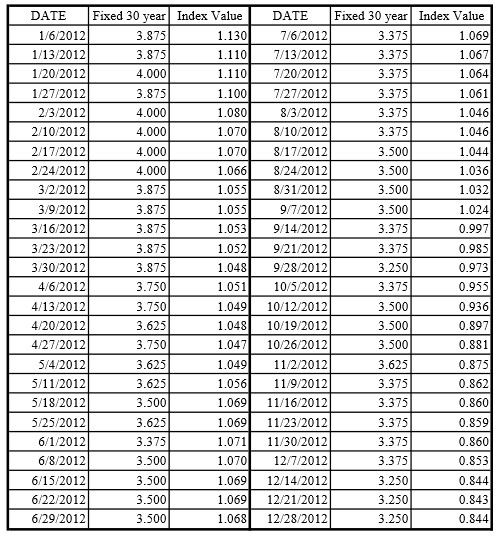
Over the years I've found published mortgage rate trends don't accurately reflect the mortgage market in New York. They show a national average based on either Fannie Mae or Freddie Mac's average secondary market pricing. This pricing is based on a national average and on the price that lenders get when they sell their mortgage, not the pricing they offer to the public.
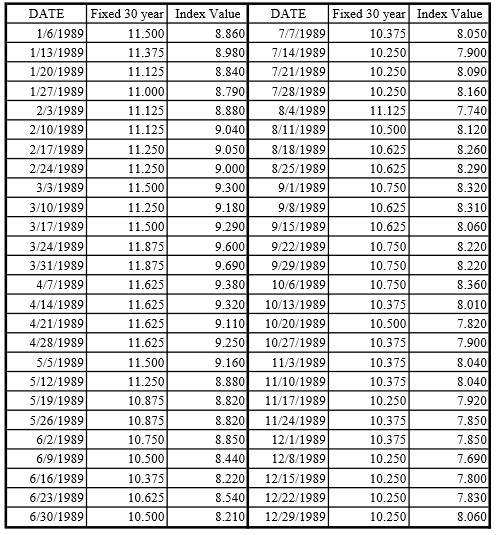
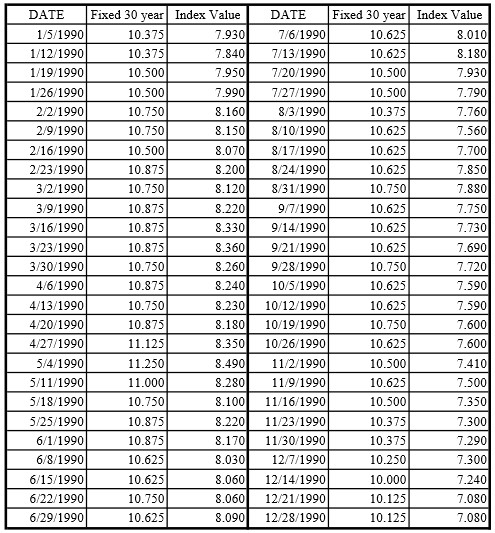
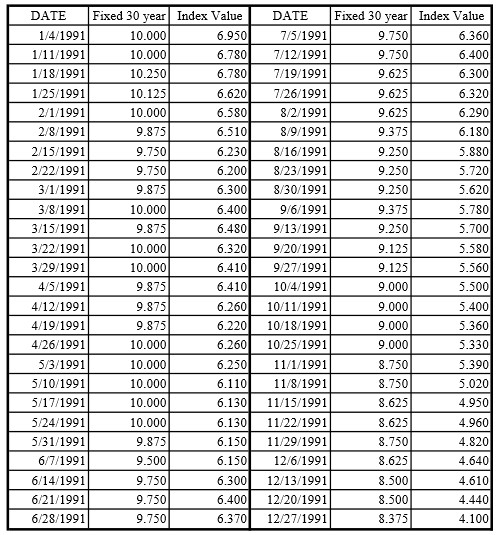
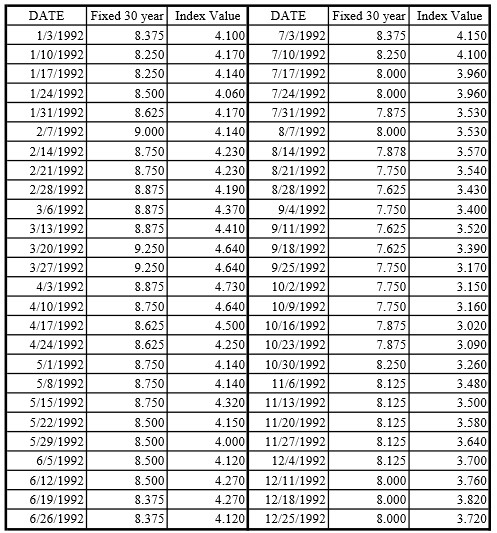
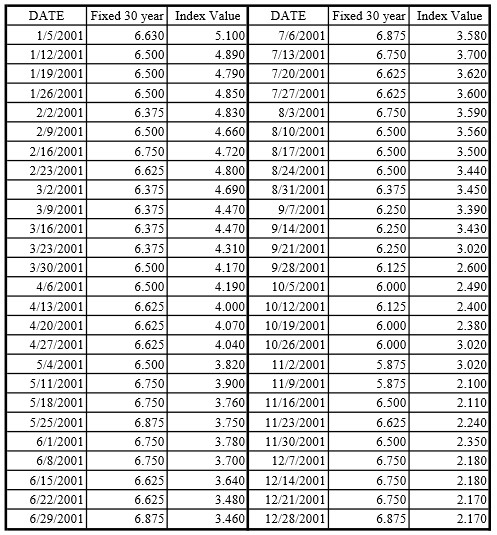
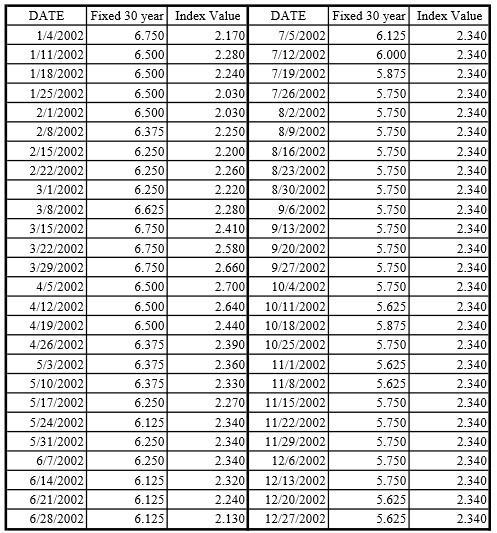
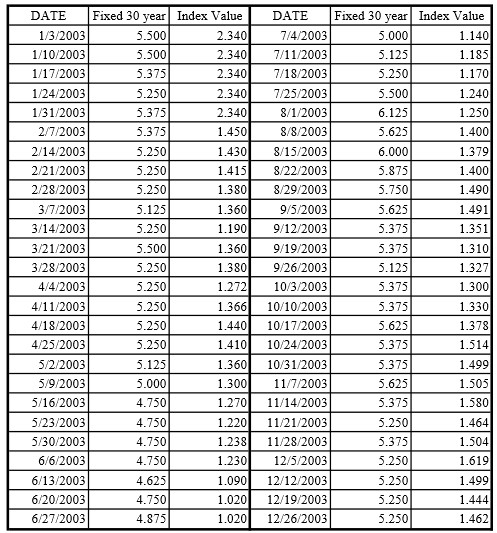
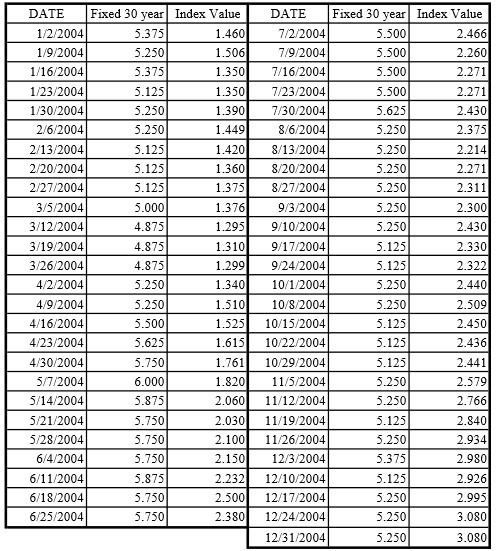
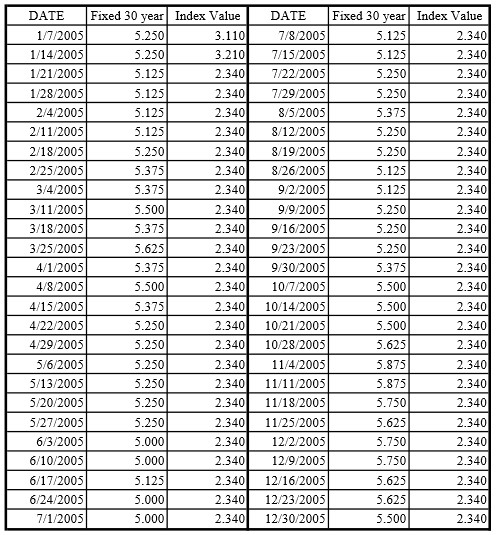
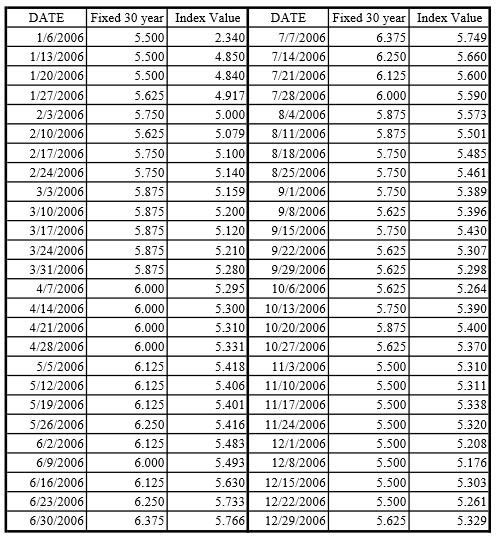
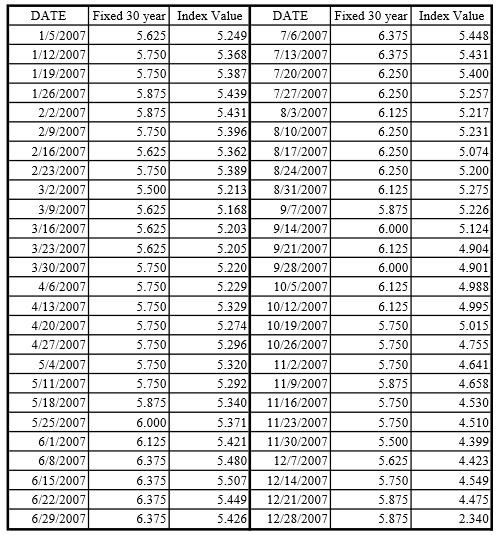
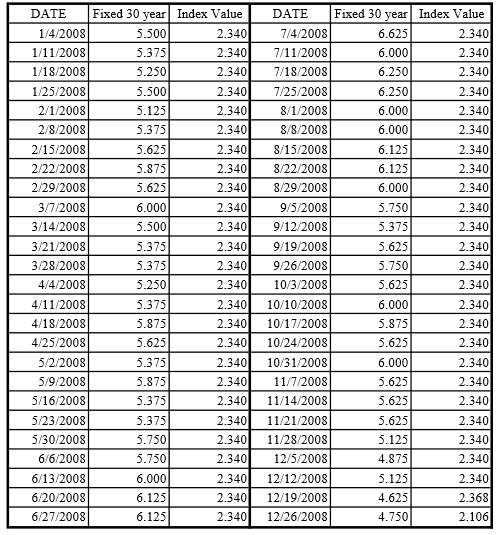
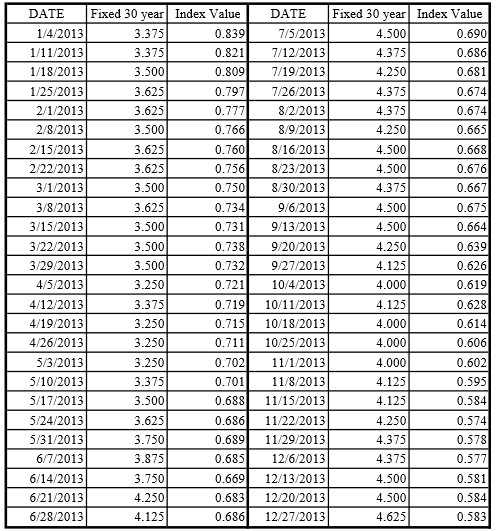
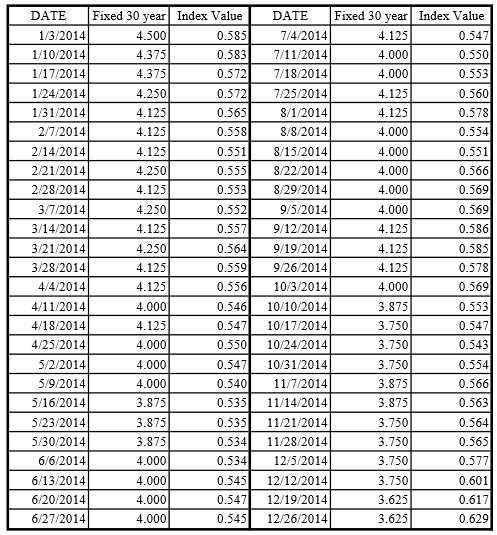
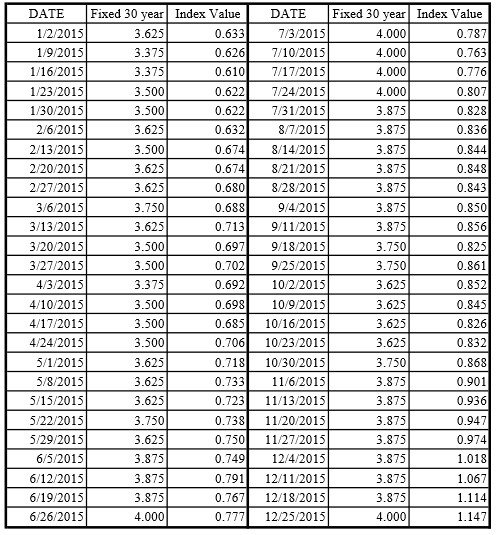
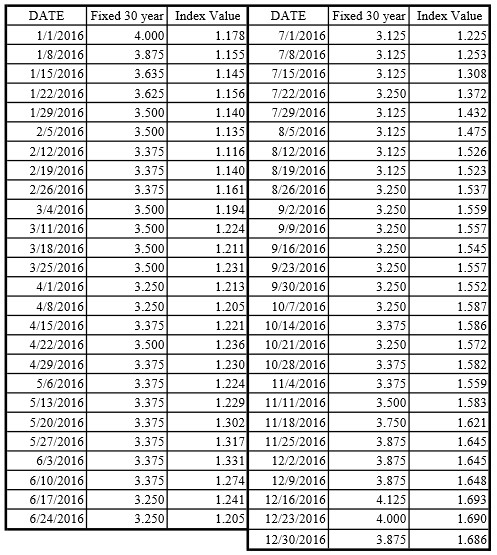
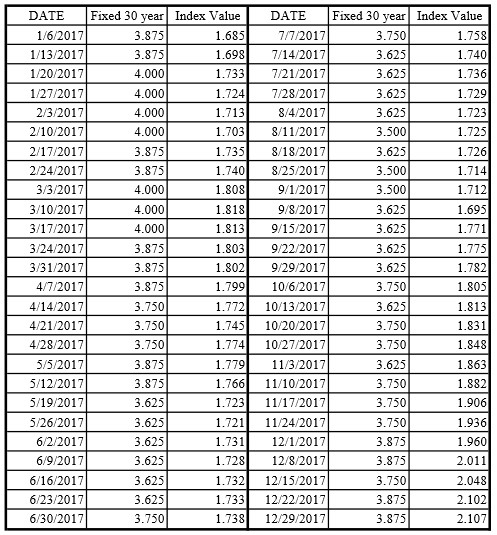
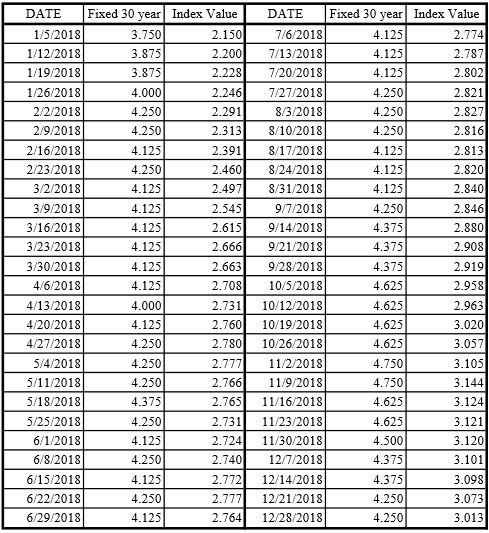
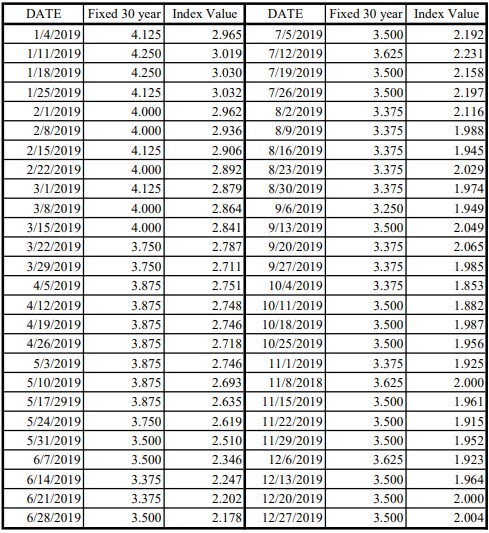
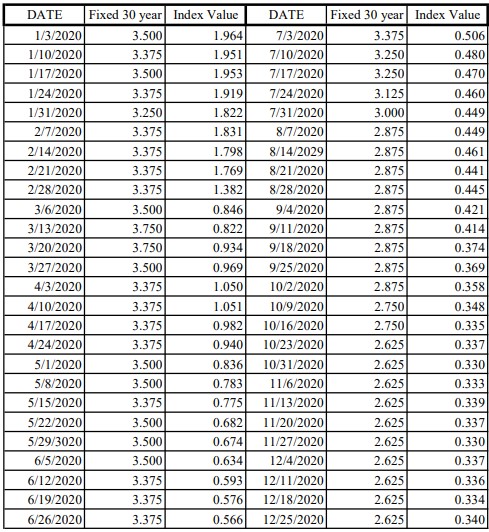
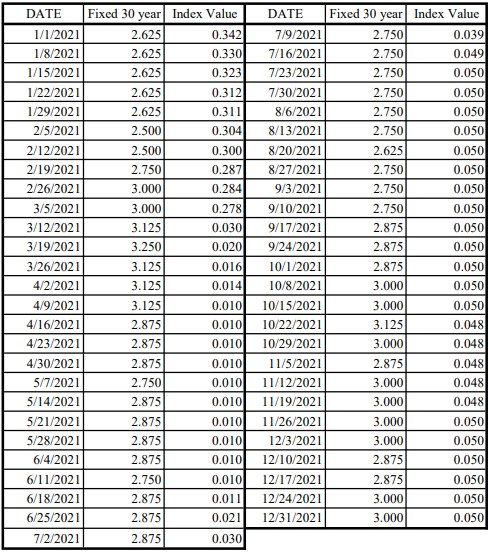
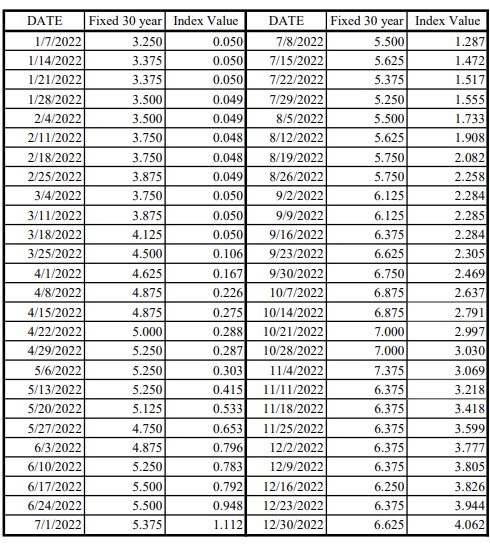
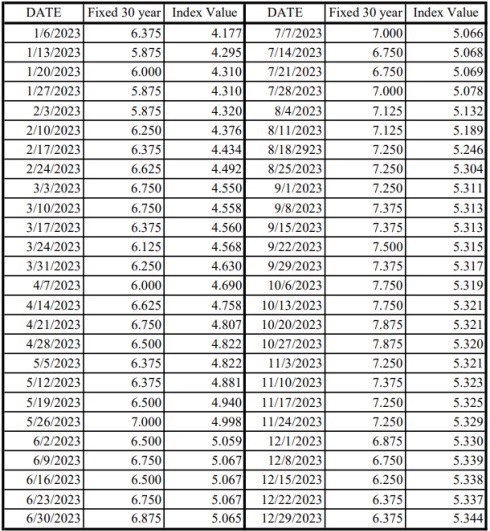
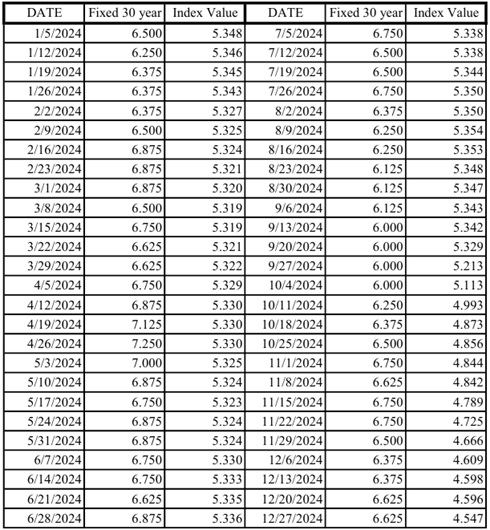
I maintain a database of the retail mortgage rates offered in the New York area.
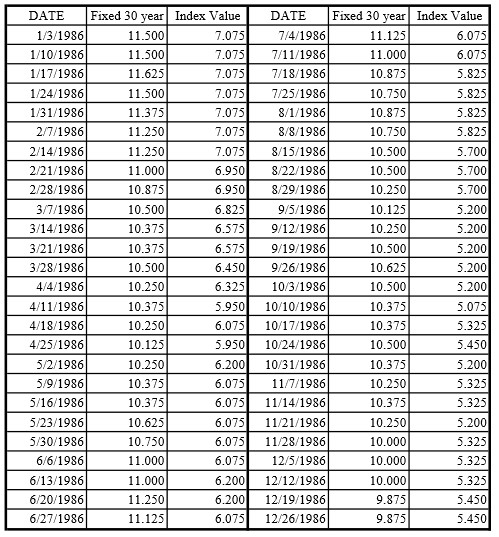
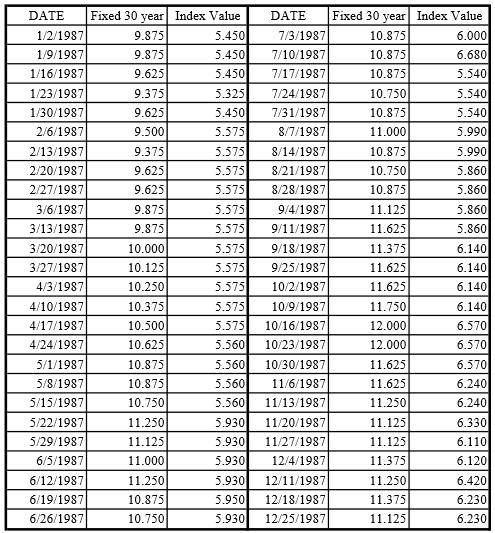
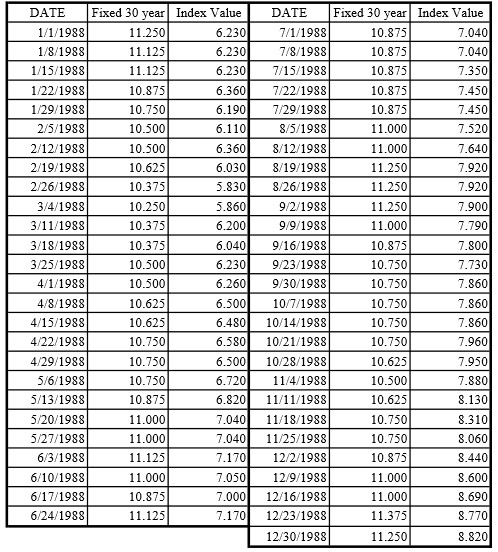
The 30 year fixed rate is based on a conforming mortgage amount with 2 points. The conforming mortgage limit is revised each year to reflect the cost of housing throughout the country. Mortgages for a higher amount, called a jumbo mortgage, will carry a higher rate of interest. The 2 point benchmark was used because through the 80's mortgages were routinely originated with points.
Most adjustable rate mortgages originated for many years were indexed to the 1 year T-Bill rate. Typically the rate would be 2.75% over the T-Bill rate. The government began reducing the national debt during the nineties, reducing the trading activity in Treasury Securities. Mortgage lenders began to shift from using the 1-year T-Bill to using the LIBOR as the index. LIBOR is an international index. Shifting to this index also made it easier for lenders to trade mortgages globally.
The "ARM Index" shown is the T-Bill rate up to January, 2003. At which point we are showing LIBOR (London Inter-Bank Offered Rate) as the "ARM Index". Typically a spread of 2.25% over LIBOR would be the rate charged. In March of 2021 LIBOR was discontinued as an index due a price fixing scandal and replaced with a new index, SOFR (The Secured Overnight Financing Rate). The typical spread became 2.75%.
The "ARM Index" is shown for comparison purposes only.
1986
1987
1988
1989
1990
1991
1992
1993
1994
1995
1996
1997
1998
1999
2000
2001
2002
2003
2004
2005
2006
2007
2008
2009
2010
2011
2012
2013
2014
2015
2016
2017
2018
2019
2020
2021
2022
2023
2024
2025